Project information
- Technologies: Vanilla JavaScript, D3, HTML5, CSS3
- Project URL: github.io/united_stats_of_america
United Stats of America
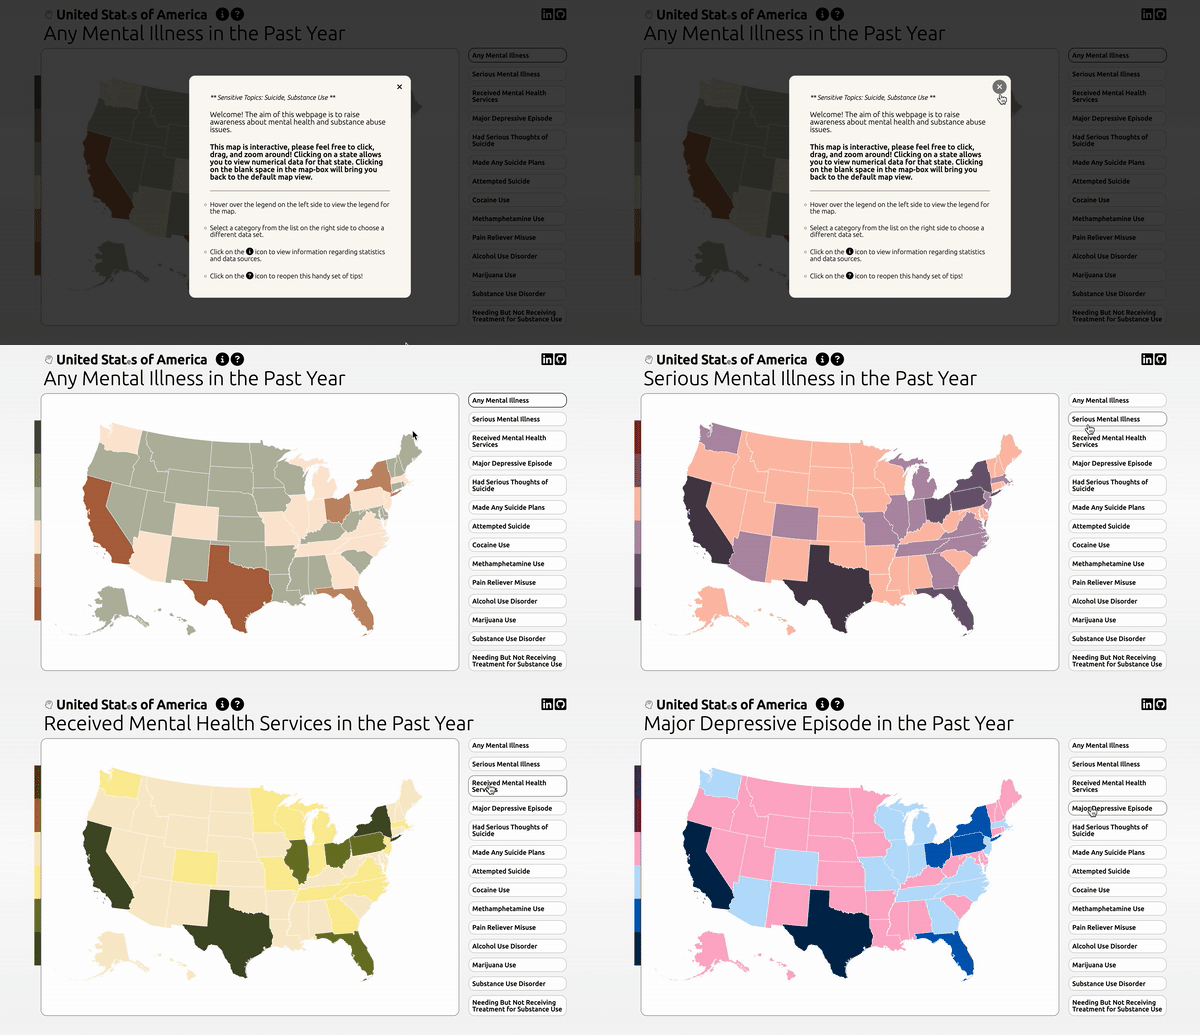
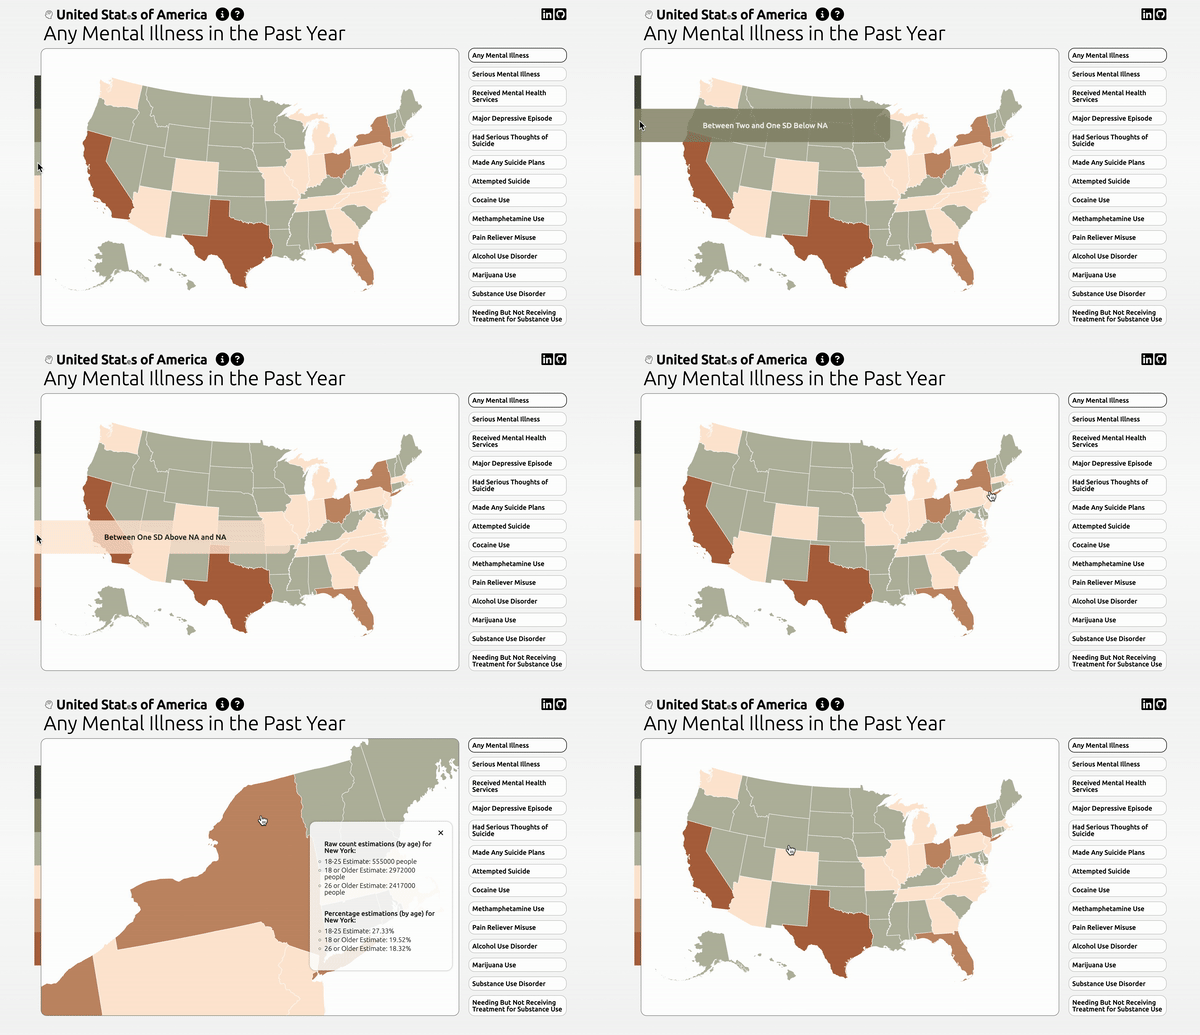
This is a vanilla JavaScript data visualization project of mental health statistics for the U.S.A. The D3 library was used to render the choropleth map, in which each state is colored depending on its respective deviation from the national average. Clicking on different categories will map over respective CSV files to recolor the map accordingly.


